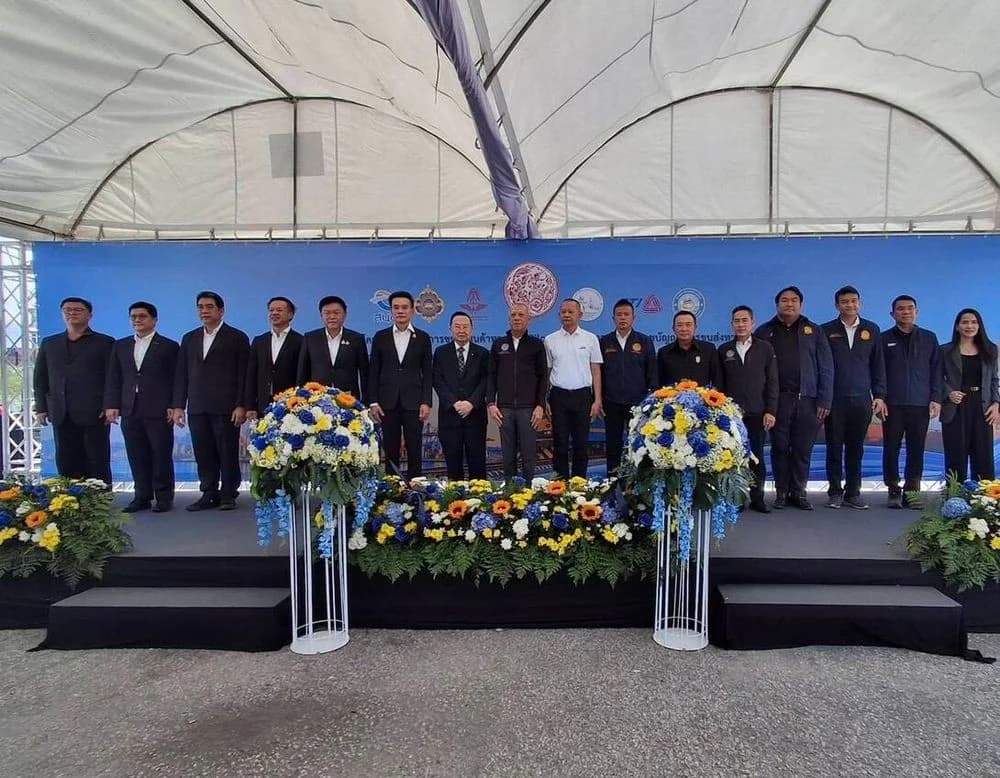

วันอังคารที่ 28 มกราคม 2568 นายสุรพงษ์ ไพสิฐพัฒนพงษ์ ที่ปรึกษาประธานกลุ่มอุตสาหกรรมยานยนต์และโฆษกกลุ่มอุตสาหกรรมยานยนต์ สภาอุตสาหกรรมแห่งประเทศไทย (ส.อ.ท.) เปิดเผยจำนวนการผลิต ยอดขายภายในประเทศ และการส่งออกรถยนต์และรถจักรยานยนต์เดือนธันวาคม 2567 มีทั้งสิ้น 104,878 คัน ลดลงจากเดือนธันวาคม 2566 ร้อยละ 17.37 ลดลงจากการผลิตขายในประเทศลดลงร้อยละ 28.50 ตามยอดขายในประเทศที่ลดลง และผลิตส่งออกลดลงร้อยละ 9.47 ตามยอดส่งออกที่ลดลง จำนวนรถยนต์ที่ผลิตได้ในเดือนมกราคม - ธันวาคม 2567 มีจำนวนทั้งสิ้น 1,468,997 คัน ลดลงจากเดือนมกราคม - ธันวาคม 2566 ร้อยละ 19.95 รถยนต์นั่ง เดือนธันวาคม 2567 ผลิตได้ 38,749 คัน ลดลงจากเดือนธันวาคม 2566 ร้อยละ 17.75
การผลิต
จำนวนรถยนต์ทั้งหมดที่ผลิตได้ในเดือนธันวาคม 2567 มีทั้งสิ้น 104,878 คัน ลดลงจากเดือนธันวาคม 2566 ร้อยละ 17.37 ลดลงจากการผลิตขายในประเทศลดลงร้อยละ 28.50 ตามยอดขายในประเทศที่ลดลง และผลิตส่งออกลดลงร้อยละ 9.47 ตามยอดส่งออกที่ลดลง
จำนวนรถยนต์ที่ผลิตได้ในเดือนมกราคม - ธันวาคม 2567 มีจำนวนทั้งสิ้น 1,468,997 คัน ลดลงจากเดือนมกราคม - ธันวาคม 2566 ร้อยละ 19.95
รถยนต์นั่ง เดือนธันวาคม 2567 ผลิตได้ 38,749 คัน ลดลงจากเดือนธันวาคม 2566 ร้อยละ 17.75 โดยแบ่งเป็น
• รถยนต์นั่ง Internal Combustion Engine มีจำนวน 19,127 คัน ลดลงจากเดือนธันวาคม 2566 ร้อยละ 40.41
• รถยนต์นั่ง Battery Electric Vehicle มีจำนวน 1,198 คัน เพิ่มขึ้นจากเดือนธันวาคม 2566 ร้อยละ 19,866.67
• รถยนต์นั่ง Plug-in Hybrid Electric Vehicle มีจำนวน 2,528 คัน เพิ่มขึ้นจากเดือนธันวาคม 2566 ร้อยละ 1,070.37
• รถยนต์นั่ง Hybrid Electric Vehicle มีจำนวน 15,896 คัน เพิ่มขึ้นจากเดือนธันวาคม 2566 ร้อยละ 7.47
ยอดผลิตของรถยนต์นั่ง ตั้งแต่เดือนมกราคม - ธันวาคม 2567 มีจำนวน 558,440 คัน เท่ากับร้อยละ 38.02 ของยอดการผลิตทั้งหมด ลดลงจากเดือนมกราคม - ธันวาคม 2566 ร้อยละ 13.53 โดยแบ่งเป็น
• รถยนต์นั่ง Internal Combustion Engine มีจำนวน 349,934 คัน ลดลงจากเดือนมกราคม - ธันวาคม 2566 ร้อยละ 28.66
• รถยนต์นั่ง Battery Electric Vehicle มีจำนวน 9,688 คัน เพิ่มขึ้นจากเดือนมกราคม - ธันวาคม 2566 ร้อยละ 5,807.32
• รถยนต์นั่ง Plug-in Hybrid Electric Vehicle มีจำนวน 7,981 คัน ลดลงจากเดือนมกราคม - ธันวาคม 2566 ร้อยละ 11.22
• รถยนต์นั่ง Hybrid Electric Vehicle มีจำนวน 190,837 คัน เพิ่มขึ้นจากเดือนมกราคม - ธันวาคม 2566 ร้อยละ 30.58
รถยนต์โดยสารขนาดต่ำกว่า 10 ตัน และมากกว่า 10 ตัน ขึ้นไป ในเดือนธันวาคม 2567 ไม่มีการผลิต รวมเดือนมกราคม - ธันวาคม 2567 ผลิตได้ 10 คัน ลดลงจากปีที่แล้วร้อยละ 91.53
รถยนต์บรรทุก เดือนธันวาคม 2567 ผลิตได้ทั้งหมด 66,129 คัน ลดลงจากเดือนธันวาคม 2566 ร้อยละ17.14 และตั้งแต่เดือนมกราคม - ธันวาคม 2567 ผลิตได้ทั้งสิ้น 910,547 คัน ลดลงจากเดือนมกราคม – ธันวาคม 2566 ร้อยละ 23.42
รถกระบะขนาด 1 ตัน เดือนธันวาคม 2567 ผลิตได้ทั้งหมด 65,168 คัน ลดลงจากเดือนธันวาคม 2566 ร้อยละ 15.12 และตั้งแต่เดือนมกราคม - ธันวาคม 2567 ผลิตได้ทั้งสิ้น 893,700 คัน เท่ากับร้อยละ 60.84 ของยอดการผลิตทั้งหมด ลดลงจากเดือนมกราคม – ธันวาคม 2566 ร้อยละ 22.39 โดยแบ่งเป็น
• รถกระบะบรรทุก 141,819 คัน ลดลงจากเดือนมกราคม - ธันวาคม 2566 ร้อยละ 30.46
• รถกระบะดับเบิลแค็บ 592,547 คัน ลดลงจากเดือนมกราคม - ธันวาคม 2566 ร้อยละ 21.48
• รถกระบะ PPV 159,334 คัน ลดลงจากเดือนมกราคม - ธันวาคม 2566 ร้อยละ 17.43
รถบรรทุกขนาดต่ำกว่า 5 ตัน - มากกว่า 10 ตัน เดือนธันวาคม 2567 ผลิตได้ 961 คัน ลดลงจากเดือนธันวาคม 2566 ร้อยละ 68.29 รวมเดือนมกราคม - ธันวาคม 2567 ผลิตได้ 16,847 คัน ลดลงจากเดือนมกราคม - ธันวาคม 2566 ร้อยละ 55.04
ผลิตเพื่อส่งออก
เดือนธันวาคม 2567 ผลิตได้ 67,203 คัน เท่ากับร้อยละ 64.08 ของยอดการผลิตทั้งหมด ลดลงจากเดือนธันวาคม 2566 ร้อยละ 9.47 ส่วนเดือนมกราคม - ธันวาคม 2567 ผลิตเพื่อส่งออกได้ 1,009,141 คัน เท่ากับร้อยละ 68.70 ของยอดการผลิตทั้งหมด ลดลงจากปี 2566 ระยะเวลาเดียวกันร้อยละ 12.07
รถยนต์นั่ง เดือนธันวาคม 2567 ผลิตเพื่อการส่งออก 14,611 คัน ลดลงจากเดือนธันวาคม 2566 ร้อยละ 39.40 และตั้งแต่เดือนมกราคม - ธันวาคม 2567 ผลิตเพื่อส่งออกได้ทั้งสิ้น 295,353 คัน เท่ากับร้อยละ 52.89 ของยอดผลิตรถยนต์นั่ง ลดลงจากเดือนมกราคม - ธันวาคม 2566 ร้อยละ 10.54
รถกระบะขนาด 1 ตัน เดือนธันวาคม 2567 มียอดการผลิตเพื่อการส่งออก 52,592 คัน เพิ่มขึ้นจากเดือนธันวาคม 2566 ร้อยละ 4.93 และตั้งแต่เดือนมกราคม - ธันวาคม 2567 ผลิตเพื่อส่งออกได้ทั้งสิ้น 713,788 คัน เท่ากับร้อยละ 79.87 ของยอดการผลิตรถกระบะ ลดลงจากเดือนมกราคม - ธันวาคม 2566 ร้อยละ12.69 โดยแบ่งเป็น
• รถกระบะบรรทุก 61,551 คัน ลดลงจากเดือนมกราคม-ธันวาคม 2566 ร้อยละ 19.89
• รถกระบะดับเบิลแค็บ 525,189 คัน ลดลงจากเดือนมกราคม-ธันวาคม 2566 ร้อยละ 14.37
• รถกระบะ PPV 127,048 คัน ลดลงจากเดือนมกราคม-ธันวาคม 2566 ร้อยละ 0.23
ผลิตเพื่อจำหน่ายในประเทศ
เดือนธันวาคม 2567 ผลิตได้ 37,675 คัน เท่ากับร้อยละ 35.92 ของยอดการผลิตทั้งหมด ลดลงจากเดือนธันวาคม 2566 ร้อยละ 28.50 และเดือนมกราคม - ธันวาคม 2567 ผลิตได้ 459,856 คัน เท่ากับร้อยละ 31.30 ของยอดการผลิตทั้งหมด ลดลงจากเดือนมกราคม – ธันวาคม 2566 ร้อยละ 33.09
รถยนต์นั่ง เดือนธันวาคม 2567 ผลิตเพื่อจำหน่ายในประเทศ 24,138 คัน เพิ่มขึ้นจากเดือนธันวาคม 2566 ร้อยละ 4.94 แต่ตั้งแต่เดือนมกราคม - ธันวาคม 2566 ผลิตได้ 263,087 คัน เท่ากับร้อยละ 47.11 ของยอดการผลิตรถยนต์นั่ง โดยเมื่อเปรียบเทียบกับเดือนมกราคม - ธันวาคม 2566 ลดลงร้อยละ 16.66
รถกระบะขนาด 1 ตัน เดือนธันวาคม 2567 มียอดการผลิตเพื่อจำหน่ายในประเทศ 12,576 คัน ลดลงจากเดือนธันวาคม 2566 ร้อยละ 52.82 และตั้งแต่เดือนมกราคม - ธันวาคม 2567 ผลิตได้ทั้งสิ้น 179,912 คัน เท่ากับร้อยละ 20.20 ของยอดการผลิตรถกระบะ และลดลงจากเดือนมกราคม - ธันวาคม 2566 ร้อยละ 46.14 ซึ่งแบ่งเป็น
• รถกระบะบรรทุก 80,268 คัน ลดลงจากเดือนมกราคม-ธันวาคม 2566 ร้อยละ 36.85
• รถกระบะดับเบิลแค็บ 67,358 คัน ลดลงจากเดือนมกราคม-ธันวาคม 2566 ร้อยละ 52.33
• รถกระบะ PPV 32,286 คัน ลดลงจากเดือนมกราคม-ธันวาคม 2566 ร้อยละ 50.80
รถยนต์โดยสารขนาดต่ำกว่า 10 ตัน และมากกว่า 10 ตัน ขึ้นไป ในเดือนธันวาคม 2567 ไม่มีการผลิต รวมเดือนมกราคม - ธันวาคม 2567 ผลิตได้ 10 คัน ลดลงจากปีที่แล้วร้อยละ 91.53
รถบรรทุก เดือนธันวาคม 2567 ผลิตได้ 961 คัน ลดลงจากเดือนธันวาคม 2566 ร้อยละ 68.29 และตั้งแต่เดือนมกราคม - ธันวาคม 2567 ผลิตได้ทั้งสิ้น 16,847 คัน ลดลงจากเดือนมกราคม - ธันวาคม 2566 ร้อยละ 55.04
รถจักรยานยนต์
เดือนธันวาคม 2567 ผลิตรถจักรยานยนต์ได้ทั้งสิ้น 202,614 คัน เพิ่มขึ้นจากเดือนธันวาคม 2566 ร้อยละ 0.74 แยกเป็นรถจักรยานยนต์สำเร็จรูป (CBU) 153,702 คัน ลดลงจากปี 2566 ร้อยละ 6.58 และชิ้นส่วนประกอบรถจักรยานยนต์ (CKD) 48,912 คัน เพิ่มขึ้นจากปี 2566 ร้อยละ 33.64
ยอดการผลิตรถจักรยานยนต์เดือนมกราคม – ธันวาคม 2567 มีจำนวนทั้งสิ้น 2,426,367 คัน ลดลงจากปี 2566 ร้อยละ 1.88 โดยแยกเป็นรถจักรยานยนต์สำเร็จรูป (CBU) 1,887,208 คัน ลดลงจากปี 2566 ร้อยละ 11.01 แต่ชิ้นส่วนประกอบรถจักรยานยนต์ (CKD) 539,159 คัน เพิ่มขึ้นจากปี 2566 ร้อยละ 53.11
ยอดขาย
ยอดขายรถยนต์ภายในประเทศของเดือนธันวาคม 2567 มีจำนวนทั้งสิ้น 54,016 คัน เพิ่มขึ้นจากเดือนพฤศจิกายน 2567 ร้อยละ 27.67 แต่ลดลงจากเดือนธันวาคม 2566 ร้อยละ 20.94 ลดลงจากการเข้มงวดในการอนุมัติสินเชื่อของสถาบันการเงินจากหนี้ครัวเรือนสูง หนี้เสียรถยนต์ยังเพิ่มขึ้นจากเศรษฐกิจขยายตัวในอัตราต่ำ ดัชนีผลผลิตอุตสาหกรรมยังคงลดลงโดย ทำให้แรงงานมีอำนาจซื้อลดลง
รถยนต์นั่งและรถยนต์นั่งตรวจการณ์ มีจำนวน 32,305 คัน เท่ากับร้อยละ 59.81 ของยอดขายทั้งหมด ลดลงจากเดือนเดียวกันในปีที่แล้วร้อยละ 18.22
• รถยนต์นั่งและรถยนต์นั่งตรวจการณ์สันดาปภายใน (ICE) 14,374 คัน เท่ากับร้อยละ 26.61 ของยอดขายทั้งหมด ลดลงจากเดือนเดียวกันปีที่แล้วที่ร้อยละ 18.12
• รถยนต์นั่งและรถยนต์นั่งตรวจการณ์ไฟฟ้า (BEV) 5,289 คัน เท่ากับร้อยละ 9.79 ของยอดขายทั้งหมด ลดลงจากเดือนเดียวกันปีที่แล้วที่ร้อยละ 39.58
• รถยนต์นั่งและรถยนต์นั่งตรวจการณ์ไฟฟ้าผสมแบบเสียบปลั๊ก (PHEV) 287 คัน เท่ากับร้อยละ 0.53 ของยอดขายทั้งหมด เพิ่มขึ้นจากเดือนเดียวกันปีที่แล้วร้อยละ 168.22
• รถยนต์นั่งและรถยนต์นั่งตรวจการณ์ไฟฟ้าผสม (HEV) 12,355 คัน เท่ากับร้อยละ 22.87 ของยอดขายทั้งหมด ลดลงจากเดือนเดียวกันปีที่แล้วร้อยละ 5.58
รถกระบะมีจำนวน 14,410 คัน ลดลงจากเดือนเดียวกันในปีที่แล้วร้อยละ 26.27 รถ PPV มีจำนวน 4,494 คัน เพิ่มขึ้นจากเดือนเดียวกันในปีที่แล้วร้อยละ 0.31 รถบรรทุก 5 – 10 ตัน มีจำนวน 1,283 คัน ลดลงจากเดือนเดียวกันในปีที่แล้วร้อยละ 61.26 และรถประเภทอื่นๆ มีจำนวน 1,524 คัน เพิ่มขึ้นจากเดือนเดียวกันในปีที่แล้ว 2.21
ส่วนรถจักรยานยนต์ มียอดขาย 124,793 คัน ลดลงจากเดือนพฤศจิกายน 2566 ร้อยละ 8.66 และลดลงจากเดือนธันวาคม 2566 ร้อยละ 5.73
ตั้งแต่เดือนมกราคม - ธันวาคม 2567 รถยนต์มียอดขาย 572,675 คัน ลดลงจากปี 2566 ในระยะเวลาเดียวกันร้อยละ 26.18 แยกเป็น
รถยนต์นั่งและรถยนต์นั่งตรวจการณ์ มีจำนวน 341,956 คันเท่ากับร้อยละ 59.71 ของยอดขายทั้งหมด ลดลงจากเดือนเดียวกันในปีที่แล้วร้อยละ 15.98
• รถยนต์นั่งและรถยนต์นั่งตรวจการณ์สันดาปภายใน (ICE) 155,044 คัน เท่ากับร้อยละ 27.07 ของยอดขายทั้งหมด ลดลงจากเดือนเดียวกันปีที่แล้วที่ร้อยละ 35.01
• รถยนต์นั่งแหละรถยนต์นั่งตรวจการณ์ไฟฟ้า (BEV) 66,732 คัน เท่ากับร้อยละ 11.85 ของยอดขายทั้งหมด ลดลงจากเดือนเดียวกันปีที่แล้วที่ร้อยละ 9.29
• รถยนต์นั่งและรถยนต์นั่งตรวจการณ์ไฟฟ้าผสมแบบเสียบปลั๊ก (PHEV) 2,391 คัน เท่ากับร้อยละ 0.42 ของยอดขายทั้งหมด เพิ่มขึ้นจากเดือนเดียวกันปีที่แล้วร้อยละ 26.17
• รถยนต์นั่งและรถยนต์นั่งตรวจการณ์ไฟฟ้าผสม (HEV) 117,789 คัน เท่ากับร้อยละ 20.57 ของยอดขายรถยนต์นั่งและรถยนต์นั่งตรวจการณ์ เพิ่มขึ้นจากเดือนเดียวกันปีที่แล้วร้อยละ 26.71
รถกระบะมีจำนวน 163,347 คัน ลดลงจากเดือนเดียวกันในปีที่แล้วร้อยละ 38.30 รถ PPV มีจำนวน 36,843 คัน ลดลงจากเดือนเดียวกันในปีที่แล้วร้อยละ 38.89 รถบรรทุก 5 – 10 ตัน มีจำนวน 16,046 คัน ลดลงจาก
เดือนเดียวกันในปีที่แล้วร้อยละ 42.03 และรถประเภทอื่นๆ มีจำนวน 14,483 คัน ลดลงจากเดือนช่วงกันในปีที่แล้ว 9.93
ส่วนรถจักรยานยนต์ มียอดขาย 1,683,239 คัน ลดลงจากเดือนมกราคม – ธันวาคม 2566 ร้อยละ 9.35 แบ่งเป็นรถจักรยานยนต์ ICE จำนวน 1,683,039 คัน ลดลงจากช่วงเวลาเดียวกันร้อยละ 9.30 รถจักรยานยนต์ BEV จำนวน 200 คัน ลดลงจากช่วงเวลาเดียวกันร้อยละ 52.38
การส่งออก
รถยนต์สำเร็จรูป
เดือนธันวาคม 2567 ส่งออกได้ 76,346 คัน ลดลงจากเดือนที่แล้วร้อยละ 14.84 แต่ลดลงจากเดือนธันวาคม 2566 ร้อยละ 15.46 ลดลงจากฐานสูงในปี 2566 และการระมัดระวังในการใช้จ่ายจากความไม่แน่นอนในความขัดแย้งระหว่างประเทศและเศรษฐกิจโลก รวมทั้งการแข่งขันจากการส่งออกรถยนต์ไฟฟ้าจากประเทศจีน และรถยนต์ใช้น้ำมันจากหลายประเทศรวมทั้งพื้นที่ในเรือไม่เพียงพอและจำนวนเที่ยวเรือลดลง รวมไปถึงมาตรการเข้มงวดการปล่อยคาร์บอนของรถยนต์ของประเทศคู่ค้าที่ทำให้รถยนต์บางรุ่นนำเข้าไม่ได้
ประเภทรถยนต์ส่งออกเดือนธันวาคม 2567 แบ่งเป็น ดังนี้
• รถกระบะ 49,931 คัน มีสัดส่วนร้อยละ 65.40 ของการส่งออกทั้งหมด ลดลงจากปี 2566 ร้อยละ 6.75
• รถยนต์นั่ง ICE 12,566 คัน มีสัดส่วนร้อยละ 16.46 ของการส่งออกทั้งหมด ลดลงจากปี 2566 ร้อยละ 41.61
• รถยนต์นั่ง HEV 4,511 คัน มีสัดส่วนร้อยละ 5.91 ของการส่งออกทั้งหมด เพิ่มขึ้นจากปี 2566 ร้อยละ 54.75
• รถ PPV 9,338 คัน มีสัดส่วนร้อยละ 12.23 ของการส่งออกทั้งหมด ลดลงจากปี 2566 ร้อยละ 24.20
มูลค่าการส่งออกรถยนต์ 52,414.34 ล้านบาท ลดลงจากเดือนธันวาคม 2566 ร้อยละ 16.14
• เครื่องยนต์ มีมูลค่าการส่งออก 2,956.81 ล้านบาท เพิ่มขึ้นจากเดือนธันวาคม 2566 ร้อยละ 5.38
• ชิ้นส่วนรถยนต์อื่นๆ มีมูลค่าการส่งออก 15,009.67 ล้านบาท ลดลงจากเดือนธันวาคม 2566 ร้อยละ 10.97
• อะไหล่รถยนต์ มีมูลค่าการส่งออก 2,249.08 ล้านบาท เพิ่มขึ้นจากเดือนธันวาคม 2566 ร้อยละ 3.62
รวมมูลค่าส่งออกรถยนต์เดือนธันวาคม 2567 เครื่องยนต์ ชิ้นส่วนรถยนต์ และอะไหล่ มีมูลค่า 72,629.90 ล้านบาท ลดลงจากเดือนธันวาคม 2566 ร้อยละ 13.88
เดือนมกราคม – ธันวาคม 2567 ส่งออกรถยนต์สำเร็จรูป 1,019,213 คัน ลดลงจากช่วงระยะเวลาเดียวกันร้อยละ 8.80 แบ่งเป็น
• รถกระบะ ICE 583,770 คัน มีสัดส่วนร้อยละ 57.28 ของการส่งออกทั้งหมด ลดลงจากปี 2566 ร้อยละ 11.49
• รถยนต์นั่ง ICE 250,184 คัน มีสัดส่วนร้อยละ 24.55 ของการส่งออกทั้งหมด ลดลงจากปี 2566 ร้อยละ 20.91
• รถยนต์นั่ง HEV 49,438 คัน มีสัดส่วนร้อยละ 4.85 ของการส่งออกทั้งหมด เพิ่มขึ้นจากปี 2566 ร้อยละ 233.03
• รถ PPV 135,821 คัน มีสัดส่วนร้อยละ 13.33 ของการส่งออกทั้งหมด เพิ่มขึ้นจากปี 2566 ร้อยละ 7.11
มูลค่าการส่งออกรถยนต์ 699,162.47 ล้านบาท ลดลงจากเดือนมกราคม – ธันวาคม 2566 ร้อยละ 2.89 โดยมีรายละเอียด ดังนี้
• เครื่องยนต์ มีมูลค่าการส่งออก 35,432.15 ล้านบาท ลดลงจากเดือนมกราคม – ธันวาคม 2566 ร้อยละ 8.33
• ชิ้นส่วนรถยนต์อื่นๆ มีมูลค่าการส่งออก 191,290.62 ล้านบาท เพิ่มขึ้นจากเดือนมกราคม – ธันวาคม 2566 ร้อยละ 0.95
•
• อะไหล่รถยนต์ มีมูลค่าการส่งออก 26,664.93 ล้านบาท เพิ่มขึ้นจากเดือนมกราคม – ธันวาคม 2566 ร้อยละ 8.15
รวมมูลค่าส่งออกรถยนต์เดือนมกราคม – ธันวาคม 2567 เครื่องยนต์ ชิ้นส่วนรถยนต์ และอะไหล่ มีมูลค่า 952,550.17 ล้านบาท ลดลงจากเดือนมกราคม – ธันวาคม 2566 ร้อยละ 2.08
รถจักรยานยนต์
เดือนธันวาคม 2567 มีจำนวนส่งออก 81,175 คัน (รวม CBU + CKD) ลดลงจากเดือนพฤศจิกายน 2567 ร้อยละ 0.06 แต่เพิ่มขึ้นจากเดือนธันวาคม 2566 ร้อยละ 6.01 โดยมีมูลค่า 5,361.58 ล้านบาท ลดลงจากเดือนธันวาคม 2566 ร้อยละ 6.98
• ชิ้นส่วนรถจักรยานยนต์ มีมูลค่าการส่งออกทั้งสิ้น 124.06 ล้านบาท ลดลงจากเดือนธันวาคม 2566 ร้อยละ 23.95
• อะไหล่รถจักรยานยนต์ มีมูลค่าการส่งออกทั้งสิ้น 181.62 ล้านบาท เพิ่มขึ้นจากเดือนธันวาคม 2566 ร้อยละ 27.40
รวมมูลค่าการส่งออกรถจักรยานยนต์ เดือนธันวาคม 2567 ชิ้นส่วนและอะไหล่รถจักรยานยนต์ 5,667.26 ล้านบาท ลดลงจากเดือนธันวาคม 2566 ร้อยละ 6.63
เดือนมกราคม – ธันวาคม 2567 รถจักรยานยนต์ มีจำนวนส่งออก 938,762 คัน (รวม CBU + CKD) เพิ่มขึ้นจากปี 2566 ร้อยละ 14.12 มีมูลค่า 63,968.75 ล้านบาท ลดลงจากปี 2566 ร้อยละ 6.74
• ชิ้นส่วนรถจักรยานยนต์ มีมูลค่าการส่งออกทั้งสิ้น 2,522.96 ล้านบาท ลดลงจากปี 2566 ร้อยละ 13.75
• อะไหล่รถจักรยานยนต์ มีมูลค่าการส่งออกทั้งสิ้น 1,973.25 ล้านบาท เพิ่มขึ้นจากปี 2566 ร้อยละ 4.04
รวมมูลค่าการส่งออกรถจักรยานยนต์เดือนมกราคม – ธันวาคม 2567 ชิ้นส่วนและอะไหล่รถจักรยานยนต์ มีทั้งสิ้น 68,464.95 ล้านบาท ลดลงจากเดือนมกราคม – ธันวาคม 2566 ร้อยละ 6.74
เดือนธันวาคม 2567 รวมมูลค่าการส่งออกรถยนต์สำเร็จรูป เครื่องยนต์ ชิ้นส่วนอื่น ๆ อะไหล่รถยนต์ รถจักรยานยนต์ ชิ้นส่วน และอะไหล่รถจักรยานยนต์ มีทั้งสิ้น 78,297.16 ล้านบาท ลดลงจากปี 2566 ร้อยละ13.39
เดือนมกราคม – ธันวาคม 2567 รวมมูลค่าการส่งออกรถยนต์สำเร็จรูป เครื่องยนต์ ชิ้นส่วนอื่นๆ อะไหล่รถยนต์ รถจักรยานยนต์ ชิ้นส่วน และอะไหล่รถจักรยานยนต์ มีทั้งสิ้น 1,021,015.12 ล้านบาท ลดลงจากปี 2566 ร้อยละ 2.41
ปี พ.ศ.2568 เป้าผลิตรถยนต์ 1,500,000 คัน เพิ่มขึ้นร้อยละ 2.11
เป้าผลิตรถจักรยานยนต์ 2,100,000 คัน เพิ่มขึ้นร้อยละ 11.28
********************************
นายสุรพงษ์ ไพสิฐพัฒนพงษ์ ปรึกษาประธานกลุ่มอุตสาหกรรมยานยนต์และโฆษกกลุ่มอุตสาหกรรมยานยนต์ สภาอุตสาหกรรมแห่งประเทศไทย (ส.อ.ท.) เปิดเผยตัวเลขประมาณการการผลิตรถยนต์และรถจักรยานยนต์ของสมาชิกกลุ่มฯ ในปี พ.ศ.2568 โดยแยกเป็นการผลิตเพื่อการส่งออก และการผลิตเพื่อจำหน่ายในประเทศ ดังนี้
รถยนต์
ประมาณการการผลิตรถยนต์ในปี พ.ศ.2567 ประมาณ 1,500,000 คัน มากกว่าปี พ.ศ.2567 ซึ่งมีจำนวน 1,468,997 คัน เพิ่มขึ้นร้อยละ 2.11 โดยแบ่งเป็นการผลิตเพื่อการส่งออกประมาณ 1,000,000 คัน เท่ากับร้อยละ 66.66 ของยอดการผลิตทั้งหมด และผลิตเพื่อจำหน่ายในประเทศประมาณ 500,000 คัน เท่ากับร้อยละ 33.34 ของยอดการผลิตทั้งหมด
• ผลิตเพื่อการส่งออก จำนวน 1,000,000 คัน ปีที่แล้วที่ผลิตได้ 1,009,141 คัน ลดลงร้อยละ 0.91
ปัจจัยบวก ดังต่อไปนี้
o ระยะสั้นจากการขึ้นภาษีนำเข้าของประเทศสหรัฐอเมริกาไม่สูงมากนักอาจจะไม่กระทบมูลค่าการค้าโลกมากดังที่กังวลกันซึ่งต้องติดตามอย่างใกล้ชิด
o อัตราดอกเบี้ยอาจลดลงและราคาน้ำมันอาจลดลงทำให้อำนาจซื้อของประเทศคู่ค้าสูงขึ้นส่งผลให้การส่งออกดีขึ้น ต้องติดตามว่าลดลงมากน้อยแค่ไหน
o ติดตามสงครามในภูมิภาคต่างๆ ว่ายุติได้หรือไม่ซึ่งจะส่งผลต่อการตัดสินใจใช้เงินของประชาชนในประเทศต่าง ๆ
ปัจจัยลบ ดังต่อไปนี้
o ความชัดเจนในมาตรการด้านการค้าและอื่น ๆ ของประธานาธิบดีโดนัลด์ ทรัมป์ว่าจะขึ้นภาษีากรนำเข้าอีกมากน้อยแค่ไหน
o คู่แข่งในประเทศคู่ค้ามีมากขึ้น
o ประเทศคู่ค้ามีการผลิตรถกระบะซึ่งอาจลดคำสั่งซื้อและอาจส่งออกแทนประเทศไทยจากการผลิตรถกระบะลดลง
o ความขัดแย้งและการสู้รบในภูมิภาคต่าง ๆ อาจขยายเพิ่มขึ้นทั้งภูมิภาคเดิมและภูมิภาคใหม่
o มาตรการเข้มงวดการปล่อยคาร์บอนของรถยนต์ของประเทศคู่ค้าที่ทำให้รถยนต์บางรุ่นนำเข้าไม่ได้
• ผลิตเพื่อจำหน่ายในประเทศ จำนวน 500,000 คัน ปีที่แล้วที่ผลิตได้ 459,856 คัน เพิ่มขึ้นร้อยละ 8.73
ปัจจัยบวก ดังต่อไปนี้
o การผลิตรถยนต์ไฟฟ้าชดเชยการนำเข้ารถยนต์ไฟฟ้าโครงการ EV 3.0 ในอัตรา 1.5 เท่า
o เศรษฐกิจในประเทศขยายตัว 2.4-2.9%
o คาดนักท่องเที่ยวต่างชาติเพิ่มขึ้นจากปี 2567
o ส่งออกสินค้าเกษตรและอุตสาหกรรมเกษตรรวมทั้งสินค้าอุตสาหกรรมบางกลุ่มขยายตัวเพิ่มขึ้น
o การแจกเงินของรัฐบาลให้กลุ่มต่าง ๆ
o การกระตุ้นเศรษฐกิจ e-Receipt
o การลงทุนของภาครัฐ
o ปี 2567 มีผู้ขอรับส่งเสริมการลงทุนในประเทศสูงถึง 1.12 ล้านล้านบาทสูงที่สุดในรอบสิบปี เพิ่มขึ้นร้อยละ 35 จากปี 2566 โดยยานยนต์และชิ้นส่วนยานยนต์ 102,366 ล้านบาท
o จะมีการลดดอกเบี้ยในประเทศซึ่งจะทำให้ต้นทุนและภาระการชำระหนี้ลดลงช่วยเพิ่มอำนาจซื้อในประเทศ
o ราคาน้ำมันอาจลดลงจากการเรียกร้องของประธานาธิบดีสหรัฐซึ่งจะทำให้ภาระค่าใช้จ่ายและต้นทุนการดำเนินงานลดลง อำนาจซื้อของประชาชนมากขึ้น
ปัจจัยลบ ดังต่อไปนี้
o ความเข้มงวดการอนุมัติสินเชื่อของสถาบันการเงิน เพราะมาตรการการปล่อยสินเชื่อแบบรับผิดชอบจากหนี้ครัวเรือนที่อยู่ในระดับสูง
o ติดตามดัชนีผลผลิตอุตสาหกรรมจะยังคงลดลงหรือไม่เพราะมีสัดส่วนถึงร้อยละ 30 ของเศรษฐกิจในประเทศและมีแรงงานถึงร้อยละ 16 ของแรงงานทั้งหมดในประเทศไทยซึ่งเกี่ยวข้องกับอำนาจซื้อในประเทศ
o สงครามการค้าระหว่างสหรัฐอเมริกากับจีนอาจจะไม่รุนแรงซึ่งจะทำให้การย้ายฐานการผลิตออกจากประเทศจีนมายังประเทศไทยชะลอตัวลงได้เพราะประเทศไทยได้เปรียบดุลการค้ากับสหรัฐอเมริกาซึ่งจะส่งผลกระทบการจ้างงานในประเทศไทย
o หนี้สาธารณะอยู่ในระดับสูงอาจจะส่งผลต่อการกระตุ้นเศรษฐกิจของรัฐบาล
o ค่าครองชีพยังทรงตัวในระดับสูงซึ่งจะส่งผลต่ออำนาจซื้อของประชาชน
รถจักรยานยนต์
ประมาณการการผลิตรถจักรยานยนต์ในปี พ.ศ.2568 ประมาณ 2,100,000 คัน มากกว่าปี พ.ศ.2567 ซึ่งมีจำนวน 1,487,605 คัน เพิ่มขึ้นร้อยละ 0.10 โดยแบ่งเป็นการผลิตเพื่อการส่งออกประมาณ 400,000 คัน เท่ากับร้อยละ 19.04 ของยอดการผลิตทั้งหมด และผลิตเพื่อจำหน่ายในประเทศประมาณ 1,700,000 คัน เท่ากับร้อยละ 80.96 ของยอดการผลิตทั้งหมด
• ผลิตเพื่อการส่งออก จำนวน 400,000 คัน เพิ่มขึ้นจากปีที่แล้วร้อยละ 0.10
• ผลิตเพื่อจำหน่ายในประเทศ จำนวน 1,700,000 คัน เพิ่มขึ้นจากปีที่แล้วที่ร้อยละ 14.28
**------------------------------------------------------------------**
ยานยนต์ไฟฟ้าป้ายแดงประเภท BEV เดือนธันวาคม 2567
เดือนธันวาคม 2567 มียานยนต์ประเภทไฟฟ้า (BEV) จดทะเบียนใหม่มีจำนวน 7,146 คัน ลดลงจากเดือนธันวาคมปีที่แล้วร้อยละ 36.12 โดยแบ่งเป็น
• รถยนต์นั่งและรถยนต์ประเภทต่างๆ มีทั้งสิ้น 5,352 คัน ลดลงจากเดือนธันวาคม 2566 ร้อยละ 42.03
o รถยนต์นั่งจำนวน 5,147 คัน
o รถยนต์โดยสารไม่เกิน 7 คนจำนวน 195 คัน
o รถยนต์บริการธุรกิจจำนวน 2 คัน
o รถยนต์บริการทัศนาจรจำนวน 8 คัน
• รถกระบะ รถแวนมีทั้งสิ้น 35 คัน ลดลงจากเดือนธันวาคม 2566 ร้อยละ 12.50
• รถยนต์สามล้อรับจ้างมีทั้งสิ้น 2 คัน ลดลงจากเดือนธันวาคม 2566 ร้อยละ 95.35
o รถยนต์รับจ้างสามล้อจำนวน 2 คัน
• รถจักรยานยนต์มีทั้งสิ้น 1,648 คัน ลดลงจากเดือนธันวาคม 2566 ร้อยละ 10.77
o รถจักรยานยนต์ส่วนบุคคลจำนวน 1,648 คัน
• รถโดยสารมีทั้งสิ้น 79 คัน เพิ่มขึ้นจากเดือนธันวาคมปีที่แล้วร้อยละ 1,028.57
• รถบรรทุกมีทั้งสิ้น 30 คัน เพิ่มขึ้นจากเดือนธันวาคมปีที่แล้วร้อยละ 66.67
เดือนมกราคม - ธันวาคม 2567 มียานยนต์ประเภทไฟฟ้า (BEV) จดทะเบียนใหม่สะสมมีจำนวน 96,804 คัน ลดลงจากเดือนมกราคม - ธันวาคมปีที่แล้วร้อยละ 3.21 โดยแบ่งเป็น
• รถยนต์นั่งและรถยนต์ประเภทต่างๆ มีทั้งสิ้น 69,979 คัน ลดลงจากเดือนมกราคม - ธันวาคม 2566 ร้อยละ 8.07
o รถยนต์นั่งจำนวน 68,023 คัน
o รถยนต์โดยสารไม่เกิน 7 คนจำนวน 1,860 คัน
o รถยนต์บริการธุรกิจจำนวน 12 คัน
o รถยนต์บริการทัศนาจรจำนวน 81 คัน
o รถยนต์บริการให้เช่าจำนวน 3 คัน
• รถกระบะ รถแวนมีทั้งสิ้น 604 คัน เพิ่มขึ้นจากเดือนมกราคม - ธันวาคม 2566 ร้อยละ 178.34
• รถยนต์สามล้อมีทั้งสิ้น 147 คัน ลดลงจากเดือนมกราคม - ธันวาคม 2566 ร้อยละ 65.97
o รถยนต์สามล้อส่วนบุคคลจำนวน 40 คัน
o รถยนต์รับจ้างสามล้อจำนวน 107 คัน
• รถจักรยานยนต์มีทั้งสิ้น 25,119 คัน เพิ่มขึ้นจากเดือนมกราคม - ธันวาคม 2566 ร้อยละ 14.56
o รถจักรยานยนต์ส่วนบุคคลจำนวน 25,009 คัน
o รถจักรยานยนต์สาธารณะจำนวน 110 คัน
• รถโดยสารมีทั้งสิ้น 375 คัน ซึ่งลดลงเดือนมกราคม - ธันวาคม 2566 ร้อยละ 69.21
• รถบรรทุกมีทั้งสิ้น 580 คัน ซึ่งเพิ่มขึ้นเดือนมกราคม - ธันวาคม 2566 ร้อยละ 523.66
ยานยนต์ไฟฟ้าป้ายแดงประเภท HEV เดือนธันวาคม 2567
เดือนธันวาคม 2567 มียานยนต์ประเภทไฟฟ้า (HEV) จดทะเบียนใหม่มีจำนวน 5,986 คัน เพิ่มขึ้นจากเดือนธันวาคมปีที่แล้วร้อยละ 8.66 โดยแบ่งเป็น
• รถยนต์นั่งและรถประเภทต่างๆ มีทั้งสิ้น 5,937 คัน เพิ่มขึ้นจากเดือนธันวาคม 2566 ร้อยละ 8.56
o รถยนต์นั่งจำนวน 5,926 คัน
o รถยนต์โดยสารไม่เกิน 7 คนจำนวน 4 คัน
o รถยนต์บริการทัศนาจรจำนวน 7 คัน
• รถจักรยานยนต์มีทั้งสิ้น 49 คัน เพิ่มขึ้นจากเดือนธันวาคม 2566 ร้อยละ 22.50
o รถจักรยานยนต์ส่วนบุคคลจำนวน 49 คัน
เดือนมกราคม - ธันวาคม 2567 มียานยนต์ประเภทไฟฟ้า (HEV) จดทะเบียนใหม่สะสมมีจำนวน 127,214 คัน เพิ่มขึ้นจากเดือนมกราคม - ธันวาคมปีที่แล้วร้อยละ 49.54 โดยแบ่งเป็น
• รถยนต์นั่งและรถประเภทต่างๆ มีทั้งสิ้น 126,646 คัน เพิ่มขึ้นจากเดือนมกราคม – ธันวาคม 2566 ร้อยละ 49.92
o รถยนต์นั่งจำนวน 126,525 คัน
o รถยนต์โดยสารไม่เกิน 7 คนจำนวน 34 คัน
o รถยนต์บริการธุรกิจจำนวน 18 คัน
o รถยนต์บริการทัศนาจรจำนวน 66 คัน
o รถยนต์บริการให้เช่าจำนวน 3 คัน
• รถจักรยานยนต์มีทั้งสิ้น 568 คัน ลดลงจากเดือนมกราคม – ธันวาคม 2566 ร้อยละ 4.22
o รถจักรยานยนต์ส่วนบุคคลจำนวน 568 คัน
ยานยนต์ไฟฟ้าป้ายแดงประเภท PHEV เดือนธันวาคม 2567
เดือนธันวาคม 2567 มียานยนต์ประเภทไฟฟ้า (PHEV) จดทะเบียนใหม่มีจำนวน 521 คัน ลดลงจากเดือนธันวาคมปีที่แล้วร้อยละ 2.62 โดยแบ่งเป็น
• รถยนต์นั่งและรถประเภทต่างๆ มีทั้งสิ้น 521 คัน ลดลงจากเดือนธันวาคมปีที่แล้วร้อยละ 2.62
o รถยนต์นั่งจำนวน 521 คัน
เดือนมกราคม - ธันวาคม 2567 มียานยนต์ประเภทไฟฟ้า (PHEV) จดทะเบียนใหม่สะสมมีจำนวน 9,372 คัน ลดลงจากเดือนมกราคม - ธันวาคมปีที่แล้วร้อยละ 19.92 โดยแบ่งเป็น
•
• รถยนต์นั่งและรถประเภทต่างๆ มีทั้งสิ้น 9,372 คัน ลดลงจากเดือนมกราคม – ธันวาคม 2566 ร้อยละ 19.92
o รถยนต์นั่งจำนวน 9,365 คัน
o รถยนต์บริการทัศนาจรจำนวน 7 คัน
ยานยนต์ไฟฟ้าจดทะเบียนสะสมประเภท BEV ณ วันที่ 31 ธันวาคม 2567
ณ วันที่ 31 ธันวาคม 2567 ยานยนต์ไฟฟ้าจดทะเบียนสะสมประเภท BEV มีจำนวนทั้งสิ้น 227,470 คัน เพิ่มขึ้นจากปีที่แล้วร้อยละ 72.52 โดยแบ่งประเภทได้ ดังนี้
• รถยนต์นั่งและรถยนต์ประเภทต่างๆ มีทั้งสิ้น 159,266 คัน เพิ่มขึ้นจากช่วงเวลาเดียวกันปี 2566 ร้อยละ 77.48
o รถยนต์นั่งมีจำนวน 156,162 คัน เพิ่มขึ้นจากช่วงเวลาเดียวกันปี 2566 ร้อยละ 75.69
o รถยนต์โดยสารไม่เกิน 7 คนมีจำนวน 2,480 คัน เพิ่มขึ้นจากช่วงเวลาเดียวกันปี 2566 ร้อยละ 332.40
o รถยนต์บริการธุรกิจมีจำนวน 78 คัน เพิ่มขึ้นจากช่วงเวลาเดียวกันปี 2566 ร้อยละ 105.26
o รถยนต์บริการทัศนาจรมีจำนวน 156 คัน เพิ่มขึ้นจากช่วงเวลาเดียวกันปี 2566 ร้อยละ 300
o รถยนต์บริการให้เช่ามีจำนวน 3 คัน ซึ่งในช่วงเดียวกันไม่มีการจดทะเบียน
o รถยนต์รับจ้างผ่านระบบอิเล็กทรอนิกส์มีจำนวน 387 คัน เพิ่มขึ้นจากช่วงเวลาเดียวกันปี 2566 ร้อยละ 94.47
• รถกระบะและรถแวนมีจำนวน 869 คัน เพิ่มขึ้นจากช่วงเวลาเดียวกันปี 2566 ร้อยละ 211.47
• รถยนต์ 3 ล้อมีจำนวนทั้งสิ้น 1,017 คัน เพิ่มขึ้นจากช่วงเวลาเดียวกันปี 2566 ร้อยละ 12.87
o รถยนต์สามล้อส่วนบุคคลมีจำนวน 113 คัน เพิ่มขึ้นจากช่วงเวลาเดียวกันปี 2566 ร้อยละ 41.25
o รถยนต์รับจ้างสามล้อมีจำนวน 904 คัน เพิ่มขึ้นจากช่วงเวลาเดียวกันปี 2566 ร้อยละ 10.11
• รถจักรยานยนต์มีจำนวนทั้งสิ้น 62,631 คัน เพิ่มขึ้นจากช่วงเวลาเดียวกันปี 2566 ร้อยละ 63.91
o รถจักรยานยนต์ส่วนบุคคลมีจำนวน 62,508 คัน เพิ่มขึ้นจากช่วงเวลาเดียวกันปี 2566 ร้อยละ 64.17
o รถจักรยานยนต์สาธารณะมีจำนวน 123 คัน ลดลงจากช่วงเวลาเดียวกันปี 2566 ร้อยละ 8.89
• อื่นๆ
o รถโดยสารมีจำนวนทั้งสิ้น 2,791 คัน เพิ่มขึ้นจากช่วงเวลาเดียวกันปี 2566 ร้อยละ 15.38
o รถบรรทุกมีจำนวนทั้งสิ้น 896 คัน เพิ่มขึ้นจากช่วงเวลาเดียวกันปี 2566 ร้อยละ 195.71
ยานยนต์ไฟฟ้าจดทะเบียนสะสมประเภท HEV ณ วันที่ 31 ธันวาคม 2567
ณ วันที่ 31 ธันวาคม 2567 ยานยนต์ไฟฟ้าจดทะเบียนสะสมประเภท HEV มีจำนวนทั้งสิ้น 469,543 คัน เพิ่มขึ้นจากปีที่แล้วร้อยละ 36.65 โดยแบ่งประเภทได้ ดังนี้
• รถยนต์นั่งและรถยนต์ประเภทต่างๆ มีทั้งสิ้น 460,178 คัน เพิ่มขึ้นจากช่วงเวลาเดียวกันปี 2566 ร้อยละ 37.57
o รถยนต์นั่งมีจำนวน 459,163 คัน เพิ่มขึ้นจากช่วงเวลาเดียวกันปี 2566 ร้อยละ 37.61
o รถยนต์รับจ้างบรรทุกคนโดยสารฯ มีจำนวน 498 คัน เพิ่มขึ้นจากช่วงเวลาเดียวกันปี 2566 ร้อยละ 4.18
o รถยนต์บริการธุรกิจ มีจำนวน 72 คัน เพิ่มขึ้นจากช่วงเวลาเดียวกันปี 2566 ร้อยละ 41.18
o รถยนต์บริการทัศนาจร มีจำนวน 216 คัน เพิ่มขึ้นจากช่วงเวลาเดียวกันปี 2566 ร้อยละ 39.35
o รถยนต์บริการให้เช่า มีจำนวน 5 คัน เพิ่มขึ้นจากช่วงเวลาเดียวกันปี 2566 ร้อยละ 150
o รถยนต์รับจ้างผ่านระบบอิเล็กทรอนิกส์มีจำนวน 224 คัน เพิ่มขึ้นจากช่วงเวลาเดียวกันปี 2566 ร้อยละ 62.32
• รถกระบะและรถแวนมีจำนวน 1 คัน เท่ากับช่วงเวลาเดียวกันปี 2566
• รถจักรยานยนต์มีจำนวนทั้งสิ้น 9,362 คัน เพิ่มขึ้นจากช่วงเวลาเดียวกันปี 2566 ร้อยละ 2.86
o รถจักรยานยนต์ส่วนบุคคลมีจำนวน 9,362 คัน เพิ่มขึ้นจากช่วงเวลาเดียวกันปี 2566 ร้อยละ 2.86
• อื่นๆ
o รถโดยสารมีจำนวนทั้งสิ้น 2 คัน ซึ่งเท่ากับช่วงเวลาเดียวกันปี 2566
ยานยนต์ไฟฟ้าจดทะเบียนสะสมประเภท PHEV ณ วันที่ 31 ธันวาคม 2567
ณ วันที่ 31 ธันวาคม 2567 ยานยนต์ไฟฟ้าจดทะเบียนสะสมประเภท PHEV มีจำนวนทั้งสิ้น 63,184 คัน เพิ่มขึ้นจากปีที่แล้วร้อยละ 17.05 โดยแบ่งประเภทได้ ดังนี้
• รถยนต์นั่งและรถประเภทต่างๆ มีทั้งสิ้น 63,184 คัน เพิ่มขึ้นจากปีที่แล้วร้อยละ 17.05
o รถยนต์นั่งมีจำนวน 63,113 คัน เพิ่มขึ้นจากช่วงเวลาเดียวกันปี 2566 ร้อยละ 17.07
o รถยนต์บริการธุรกิจมีจำนวน 43 คัน เพิ่มขึ้นจากช่วงเวลาเดียวกันปี 2566 ร้อยละ 4.88
o รถยนต์บริการทัศนาจรมีจำนวน 18 คัน ลดลงจากช่วงเวลาเดียวกันปี 2566 ร้อยละ 14.29
o รถยนต์บริการให้เช่ามีจำนวน 5 คัน เพิ่มขึ้นจากช่วงเวลาเดียวกันปี 2566 ร้อยละ 66.67
o รถยนต์รับจ้างผ่านระบบอิเล็กทรอนิกส์มีจำนวน 5 คัน เพิ่มขึ้นจากช่วงเวลาเดียวกันปี 2566 ร้อยละ 25
On Tuesday, January 28, 2025, Mr. Surapong Phaisithapattanapong, Advisor to the President of the Automotive Industry Group and Spokesperson for the Automotive Industry Group of the Federation of Thai Industries (FTI), disclosed production numbers, domestic sales, and exports of automobiles and motorcycles for December 2024. The total production reached 104,878 units, a decrease of 17.37% from December 2023, driven by a 28.50% decrease in domestic sales and a 9.47% drop in export production. In total, 1,468,997 vehicles were produced from January to December 2024, showcasing a 19.95% decline from the same period in 2023, with 38,749 passenger cars produced in December 2024, marking a 17.75% decrease year-on-year.
Production
The total number of vehicles produced in December 2024 was 104,878 units, reflecting a decrease of 17.37% from December 2023. Domestic sales production declined by 28.50%, consistent with the drop in domestic sales, and export production decreased by 9.47%, in line with reduced export volumes. During the January to December 2024 period, a total of 1,468,997 vehicles were manufactured, down 19.95% from the same period in 2023.
In December 2024, a total of 38,749 passenger cars were produced, representing a 17.75% decrease from December 2023. This figure can be categorized as follows:
• Internal Combustion Engine Passenger Cars: 19,127 units, a decrease of 40.41% from December 2023.
• Battery Electric Vehicle Passenger Cars: 1,198 units, an increase of 19,866.67% from December 2023.
• Plug-in Hybrid Electric Vehicle Passenger Cars: 2,528 units, a rise of 1,070.37% from December 2023.
• Hybrid Electric Vehicle Passenger Cars: 15,896 units, marking a 7.47% increase from December 2023.
The total production of passenger cars from January to December 2024 amounted to 558,440 units, accounting for 38.02% of total production, down 13.53% from the same period in 2023. This breaks down into:
• Internal Combustion Engine Passenger Cars: 349,934 units, a 28.66% decrease from January to December 2023.
• Battery Electric Vehicle Passenger Cars: 9,688 units, an increase of 5,807.32% from January to December 2023.
• Plug-in Hybrid Electric Vehicle Passenger Cars: 7,981 units, a 11.22% decrease from January to December 2023.
• Hybrid Electric Vehicle Passenger Cars: 190,837 units, a 30.58% increase from January to December 2023. For both light-duty and heavy-duty passenger vehicles, there was no production in December 2024, resulting in a total of 10 units produced from January to December 2024, down 91.53% from the previous year. In December 2024, 66,129 trucks were produced, down 17.14% from the same month the previous year, while total production from January to December 2024 reached 910,547 units, a decline of 23.42% from the same period in 2023.
In December 2024, a total of 65,168 one-ton pickups were produced, a decrease of 15.12% from December 2023. The total production from January to December 2024 was 893,700 units or 60.84% of total production, down 22.39% compared to January to December 2023. This includes:
• Pickup Trucks: 141,819 units, a 30.46% decrease from January to December 2023.
• Double Cab pickups: 592,547 units, down 21.48% from January to December 2023.
• Pickup Passenger Vehicles: 159,334 units, down 17.43% compared to January to December 2023.
Trucks weighing under 5 tons and over 10 tons had production of 961 units in December 2024, a decrease of 68.29% from December 2023. The total production from January to December 2024 was 16,847 units, down 55.04% from the same period in 2023.
Exports
In December 2024, production totaled 67,203 units, representing 64.08% of total production, down 9.47% compared to December 2023. For the period from January to December 2024, a total of 1,009,141 units were exported, accounting for 68.70% of total production, a drop of 12.07% from the same time period in 2023. Passenger cars produced for export in December 2024 totaled 14,611 units, a decrease of 39.40% from December 2023. From January to December 2024, a total of 295,353 were produced for export, equivalent to 52.89% of total passenger car production, down 10.54% compared to the prior year.
For one-ton pickups in December 2024, 52,592 units were produced for export, an increase of 4.93% from December 2023, with total production for export amounting to 713,788 units or 79.87% of total pickup production, a decrease of 12.69% compared to January to December 2023. Breakdown:
• Pickup Trucks: 61,551 units, down 19.89% from January to December 2023.
• Double Cab pickups: 525,189 units, down 14.37% from January to December 2023.
• Pickup Passenger Vehicles: 127,048 units, down 0.23% from January to December 2023.
Production for Domestic Sales
In December 2024, 37,675 units were produced for domestic sales, accounting for 35.92% of total production, down 28.50% from December 2023. For the period from January to December 2024, production totaled 459,856 units, equal to 31.30% of total production, down 33.09% from the same period in 2023. In December 2024, 24,138 passenger cars were produced for the domestic market, up 4.94% from December 2023, while total production from January to December 2024 amounted to 263,087 units, accounting for 47.11% of total passenger car production, a decline of 16.66% compared to January to December 2023.
One-ton pickups produced for the domestic market in December 2024 totaled 12,576 units, a decrease of 52.82% from December 2023. From January to December 2024, total production was 179,912 units, accounting for 20.20% of total pickup production, which indicates a decline of 46.14% from the preceding year. Breakdown:
• Pickup Trucks: 80,268 units, down 36.85% from January to December 2023.
• Double Cab pickups: 67,358 units, down 52.33% compared to January to December 2023.
• Pickup Passenger Vehicles: 32,286 units, down 50.80%.
Passenger vehicles under 10 tons and above 10 tons had no production in December 2024, accumulating a total of 10 units produced from January to December 2024, a decrease of 91.53%.
In December 2024, truck production reached 961 units, marking a 68.29% decrease from December 2023, while a total of 16,847 units were produced from January to December 2024, a reduction of 55.04% from the same period in 2023.
Motorcycles
In December 2024, motorcycle production totaled 202,614 units, up 0.74% from December 2023, comprising 153,702 complete built units (CBU), a decrease of 6.58% from the prior year, and 48,912 component sets (CKD), an increase of 33.64% from 2023. From January to December 2024, total motorcycle production reached 2,426,367 units, a decline of 1.88% from 2023, with 1,887,208 CBU units (down 11.01%) and 539,159 CKD units (an increase of 53.11%).
Sales
The domestic sales of vehicles in December 2024 amounted to 54,016 units, reflecting a 27.67% increase from November 2024, but a 20.94% decrease from December 2023, attributed to stringent credit granting approval by financial institutions due to high household debt. The increase in vehicle loan defaults has also been influenced by low economic growth, while the industrial production index continues to drop, reducing consumer purchasing power.
Passenger cars and light vehicles accounted for 32,305 units, constituting 59.81% of total sales, decreasing 18.22% from the same month last year. Breakdown:
• Internal Combustion Engine Passenger Cars and Light Vehicles: 14,374 units, 26.61% of total sales, a decline from 18.12% in the same month last year.
• Battery Electric Vehicle Passenger Cars and Light Vehicles: 5,289 units, 9.79% of total sales, down from 39.58% compared to the same month last year.
• Plug-in Hybrid Electric Vehicle Passenger Cars and Light Vehicles: 287 units, 0.53% of total sales, a significant increase of 168.22% year-on-year.
• Hybrid Electric Vehicle Passenger Cars and Light Vehicles: 12,355 units, representing 22.87% of total sales, a decrease of 5.58% from the previous year.
Sales of pickups reached 14,410 units, down 26.27% from the same month last year, while PPV sales were 4,494 units, up by 0.31% from the previous year. Truck sales between 5 to 10 tons totaled 1,283 units, representing a decrease of 61.26% year-on-year, while other types of vehicles saw sales of 1,524 units, reflecting a 2.21% increase year-on-year.
Motorcycle sales amounted to 124,793 units, decreasing by 8.66% from November 2024, and down 5.73% from December 2023.
From January to December 2024, vehicle sales reached 572,675 units, down 26.18% from 2023, broken down as follows:
Passenger cars and light vehicles totaled 341,956 units, which comprised 59.71% of total sales, down 15.98% from the same period last year.
• Internal Combustion Engine Passenger Cars and Light Vehicles: 155,044 units, 27.07% of total sales, a reduction from 35.01% in the same period last year.
• Battery Electric Vehicle Passenger Cars and Light Vehicles: 66,732 units, representing 11.85% of total sales, also down from 9.29% the previous year.
• Plug-in Hybrid Electric Vehicle Passenger Cars and Light Vehicles: 2,391 units, corresponding to 0.42% of total sales, a 26.17% increase from last year's figures.
• Hybrid Electric Vehicle Passenger Cars and Light Vehicles: 117,789 units, 20.57% of total passenger car and light vehicle sales, a 26.71% increase year-on-year.
Pickup truck sales were recorded at 163,347 units, down 38.30% compared to the same month last year, while PPV sales totaled 36,843 units, reflecting a 38.89% decline year-on-year. Truck sales between 5 to 10 tons accounted for 16,046 units, a decrease of 42.03% from the same month the previous year, while other vehicle types sold 14,483 units, dropping 9.93% in comparison to the previous year.
Motorcycle sales totaled 1,683,239 units, representing a 9.35% decline from January to December 2023, where ICE motorcycles accounted for 1,683,039 units, decreasing by 9.30%, and BEV motorcycles totaled 200 units, a drop of 52.38% from the same period last year.
Exports
During December 2024, 76,346 units of completed vehicles were exported, representing a decline of 14.84% from the prior month and a decrease of 15.46% year-on-year. This drop is attributed to high bases from 2023 and cautious spending driven by uncertainties from international conflicts and the global economy, alongside competition from electric vehicle exports from China and gasoline vehicles from other countries, which compounded with limited shipping space and lower shipping frequency. The stringent carbon emissions control measures enacted by partner countries have also restricted the importability of certain vehicle models.
Vehicle export types for December 2024 were categorized as follows:
• Pickups: 49,931 units, accounting for 65.40% of total exports, a decline of 6.75% year-on-year.
• Internal Combustion Engine Passenger Cars: 12,566 units, comprising 16.46% of total exports, down 41.61% from 2023.
• Hybrid Electric Vehicle Passenger Cars: 4,511 units, accounting for 5.91%, representing a 54.75% increase year-on-year.
• PPV: 9,338 units, covering 12.23% of total exports, a decrease of 24.20% from the previous year. The export value of vehicles amounted to 52,414.34 million THB, reflecting a year-on-year decrease of 16.14%.
• Engines generated an export value of 2,956.81 million THB, a 5.38% increase from December 2023.
• Other automotive parts had an export value of 15,009.67 million THB, down 10.97% from last year.
• Spare parts achieved an export value of 2,249.08 million THB, up 3.62% year-on-year.
Total exports for December 2024, including completed vehicles, engines, automotive parts, and spare parts, reached 72,629.90 million THB, down 13.88% from the same month in the previous year.
From January to December 2024, a total of 1,019,213 completed vehicles were exported, reflecting a decline of 8.80% from the prior year. Breakdown:
• ICE Pickups: 583,770 units, accounting for 57.28% of total exports, down 11.49% year-on-year.
• ICE Passenger Cars: 250,184 units, comprising 24.55% of total exports, a decrease of 20.91% from the previous year.
• HEV Passenger Cars: 49,438 units, accounting for 4.85%, significantly up by 233.03% from last year's figures.
• PPVs: 135,821 units, covering 13.33% of the total, experiencing a 7.11% increase from the previous year. The total export value reached 699,162.47 million THB, reflecting a decline of 2.89% compared to the previous year. Breakdown:
• Engines: Export value was recorded at 35,432.15 million THB, down 8.33% year-on-year.
• Other automotive parts generated an export value of 191,290.62 million THB, exhibiting an increase of 0.95% year-on-year.
• Spare parts achieved an export value of 26,664.93 million THB, representing an increase of 8.15% from the previous year. Total exports from January to December 2024, including engines, automotive parts, and spare parts, reached 952,550.17 million THB, a decrease of 2.08% from the previous year.
Motorcycles
In December 2024, a total of 81,175 units (including CBU + CKD) were exported, reflecting a 0.06% decrease from November 2024 but a 6.01% increase from December 2023, with a value of 5,361.58 million THB, down 6.98% from the previous year.
• Motorcycle parts had an export value totaling 124.06 million THB, a drop of 23.95% compared to December 2023.
• Motorcycle spare parts totaled an export value of 181.62 million THB, up 27.40% from December 2023. Total export value for motorcycles in December 2024, including parts and spare parts, reached 5,667.26 million THB, down 6.63% year-on-year.
In January to December 2024, a total of 938,762 motorcycles (including CBU + CKD) were exported, marking a 14.12% increase compared to 2023, with an export value amounting to 63,968.75 million THB, down 6.74% from the previous year.
• Motorcycle parts recorded an export value of 2,522.96 million THB, portraying a drop of 13.75% from the previous year.
• Motorcycle spare parts recorded an export value of 1,973.25 million THB, revealing a rise of 4.04% year-on-year. The total export value for motorcycles and associated components from January to December 2024 stood at 68,464.95 million THB, down 6.74% from the previous year.
In December 2024, the total export value for completed vehicles, engines, automotive parts, and motorcycle components amounted to 78,297.16 million THB, a decline of 13.39% compared to 2023. The total export value from January to December 2024 reached 1,021,015.12 million THB, a decline of 2.41% from the previous year.
In 2025, the production target for automobiles is set at 1,500,000 units, signifying a 2.11% increase, while the motorcycle production target is anticipated at 2,100,000 units, reflecting an 11.28% increase.
********************************
Mr. Surapong Phaisithapattanapong, Advisor to the President of the Automotive Industry Group and Spokesperson for the Automotive Industry Group of the Federation of Thai Industries (FTI), disclosed the estimated production figures for automobiles and motorcycles from group members for the year 2025, classified by production for export and domestic sales as follows:
Automobiles
The estimated production for 2025 is approximately 1,500,000 units, surpassing the 1,468,997 units produced in 2024, representing an increase of 2.11%. This breaks down into approximately 1,000,000 units for export, accounting for 66.66% of total production, and around 500,000 units for domestic sales, comprising 33.34% of total production.
• Production for export: 1,000,000 units, down 0.91% from last year's figure of 1,009,141 units.
Positive factors include:
o Short-term implications from the not overly high import tax increases in the United States, which may not significantly affect global trade values as originally feared, requiring close monitoring.
o Potential reductions in interest rates and oil prices may enhance purchasing power in trade partner countries, thereby improving export performance that needs to be observed closely.
o Monitoring regional conflicts to see if they conclude, which would impact spending decisions by the populations in various countries.
Negative factors include:
o Uncertainties surrounding trade and other measures from President Donald Trump regarding subsequent import tax hikes.
o Increasing competition amongst partner countries.
o Partner countries producing pickups could decrease orders and might export instead of Thailand due to decreasing pickup production.
o Evolving conflicts in various regions, whether old or new.
o Stricter carbon emissions measures affecting the importability of certain vehicle models by partner countries.
• Production for domestic sales: 500,000 units, reflecting an 8.73% increase from last year’s production of 459,856 units.
Positive factors include:
o Production of electric vehicles compensating for electric vehicle imports from the EV 3.0 initiative at a rate of 1.5 times.
o Domestic economic growth forecasted at 2.4-2.9%.
o An anticipated increase in foreign tourists compared to 2024.
o Growth expected in agricultural exports, industrial goods, and certain sectors.
o Government cash distributions to various groups.
o Stimulating the economy through e-Receipts.
o Public sector investments.
o In 2024, the number of applications for investment promotion reached the highest in ten years at 1.12 trillion THB, reflecting a 35% increase from 2023 with 102,366 million THB in the automotive and parts sectors.
o Interest rates may be lowered domestically, reducing costs and debt burdens, which could help increase domestic purchasing power.
o The potential decline in oil prices following requests from the U.S. President may alleviate operating costs and improve citizen purchasing power.
Negative factors specified include:
o Stricter credit approval from financial institutions stemming from high levels of household debt.
o Monitoring the industrial production index to ascertain whether it continues to decline, as it contributes significantly (30%) towards the domestic economy and labor (16%).
o The China-U.S. trade war may not be severe, which could slow the relocation of production bases from China to Thailand, as Thailand maintains a trade surplus with the U.S., impacting domestic employment.
o High public debt levels might affect government economic stimulation efforts.
o Cost of living remaining persistently high, affecting consumer purchasing power.
Motorcycles
The estimated production for 2025 is approximately 2,100,000 units, surpassing the 1,487,605 units produced in 2024, indicating a 0.10% increase, divided into an estimated output of about 400,000 units for export, representing 19.04% of total production, and 1,700,000 units for domestic sales, making up 80.96% of total production.
• Production for export: 400,000 units, an uptick of 0.10% from the previous year.
• Production for domestic sales: 1,700,000 units, increasing from last year by 14.28%.
**------------------------------------------------------------------**
Newly registered electric vehicles of the BEV type in December 2024
In December 2024, there were 7,146 new registrations for electric vehicles (BEV), reflecting a decrease of 36.12% from December 2023, categorized as follows:
• Passenger cars and various types: 5,352 units, down 42.03% from December 2023.
o Passenger cars: 5,147 units.
o Passenger vehicles for up to seven people: 195 units.
o Business operation vehicles: 2 units.
o Tourist vehicles: 8 units.
• Pickup and van vehicles: 35 units, down 12.50% from December 2023.
• Three-wheeled taxis: 2 units, down 95.35% from December 2023.
o Three-wheeled taxis: 2 units.
• Motorcycles totaled 1,648 units, showing a decline of 10.77% from December 2023.
o Personal motorcycles: 1,648 units.
• Buses numbered 79 units, an increase of 1,028.57% from last year.
• Trucks amounted to 30 units, a 66.67% increase compared to the previous year.
From January to December 2024, the cumulative total of newly registered electric vehicles (BEV) amounted to 96,804 units, indicating a 3.21% decline from the previous year, categorized as follows:
• Passenger cars and various types had a total of 69,979 units, a decline of 8.07% year-on-year.
o Passenger cars: 68,023 units.
o Passenger vehicles for up to seven people: 1,860 units.
o Business operation vehicles: 12 units.
o Tourist vehicles: 81 units.
• Pickup trucks and vans totaled 604 units, an increase of 178.34% compared to the previous year.
• Three-wheeled taxis amounted to 147 units, down 65.97% from last year.
o Personal three-wheeled taxis: 40 units.
o Three-wheeled taxi vehicles: 107 units.
• Motorcycles totaled 25,119 units, marking an increase of 14.56% compared to 2023.
o Personal motorcycles: 25,009 units.
o Public motorcycles: 110 units.
• Buses numbered 375 units, down 69.21% year-on-year.
• Trucks totaled 580 units, reflecting a 523.66% increase from the previous year.
Newly registered electric vehicles for the HEV type in December 2024
In December 2024, there were 5,986 new registrations for electric vehicles (HEV), marking an 8.66% increase compared to the previous year, categorized as follows:
• Passenger cars and various types totaled 5,937 units, up 8.56% from December 2023.
o Passenger cars numbered 5,926 units.
o Passenger vehicles for up to seven people: 4 units.
o Tourist vehicles: 7 units.
• Motorcycles reached 49 units, up 22.50% year-on-year.
o Personal motorcycles: 49 units.
In the period from January to December 2024, the total new registrations for electric vehicles (HEV) reached 127,214 units, reflecting a 49.54% increase from 2023, broken down as follows:
• Passenger cars and various types amounted to 126,646 units, marking a 49.92% increase from the last year.
o Passenger cars: 126,525 units.
o Passenger vehicles for up to seven people: 34 units.
o Business operation vehicles: 18 units.
o Tourist vehicles: 66 units.
o Rental vehicles: 3 units.
Newly registered electric vehicles of the PHEV type in December 2024
In December 2024, there were 521 newly registered electric vehicles (PHEV), reflecting a 2.62% decrease year-on-year, as follows:
• Passenger cars and various types totaled 521 units, down 2.62% from the previous year.
o Passenger cars numbered 521 units.
As of December 31, 2024, the cumulative total of registered electric vehicles (BEV) amounted to 227,470 units, reflecting a 72.52% increase from the previous year, further categorized as:
• Passenger cars and various types totaled 159,266 units, up 77.48% compared to the same period last year.
o Passenger cars: 156,162 units, indicating a 75.69% increase year-on-year.
o Passenger vehicles for up to seven people: 2,480 units, a 332.40% increase year-on-year.
o Business operation vehicles: 78 units, up 105.26% from the previous year.
o Tourist vehicles: 156 units, reflecting a 300% year-on-year rise.
o Rental vehicles: 3 units, with no registrations in the same period last year.
o Electronic ride-share vehicles: 387 units, a 94.47% increase from the previous year.
• Pickups and vans: 869 units, rising 211.47% year-on-year.
• Three-wheeled vehicles totaled 1,017 units, reflecting a 12.87% increase from the previous year.
o Personal three-wheeled vehicles: 113 units, up 41.25% compared to last year.
o Three-wheeled taxi vehicles: 904 units, rising 10.11% year-on-year.
• Motorcycles amounted to 62,631 units, a 63.91% increase from the same time last year.
o Personal motorcycles: 62,508 units, up 64.17% year-on-year.
o Public motorcycles: 123 units, down 8.89% compared to last year.
• Others:
o Buses totaled 2,791 units, reflecting a 15.38% year-on-year increase.
o Trucks totaled 896 units, showing an increase of 195.71% compared to the previous year.
As of December 31, 2024, the cumulative total of registered electric vehicles (HEV) was 469,543 units, marking a 36.65% increase from the previous year, categorized as follows:
• Passenger cars and various types totaled 460,178 units, reflecting a 37.57% increase year-on-year.
o Passenger cars numbered 459,163 units, up 37.61% from the same time last year.
o Passenger vehicles carrying people: 498 units, with an increase of 4.18% from the previous year.
o Business operation vehicles: 72 units, an increase of 41.18% from the previous year.
o Tourist vehicles: 216 units, a rise of 39.35% from the previous year.
o Rental vehicles: 5 units, a 150% increase from the previous year.
o Electronic ride-share vehicles: 224 units, up 62.32% from last year.
As of December 31, 2024, the cumulative total of registered electric vehicles (PHEV) was 63,184 units, indicating a 17.05% increase from the previous year, categorized as follows:
• Passenger cars and various types totaled 63,184 units, reflecting a 17.05% increase year-on-year.
o Passenger cars: 63,113 units, reflecting a 17.07% rise year-on-year.
o Business operation vehicles: 43 units, a 4.88% increase from the previous year.
o Tourist vehicles: 18 units, down 14.29% from the previous year.
o Rental vehicles: 5 units, a 66.67% increase from the previous year.